

The administration withheld the 2017–18 survey results, claiming that the data quality was inadequate. There had been reports that the administration did not want the data to show how the demonetisation and GST had affected consumer spending.
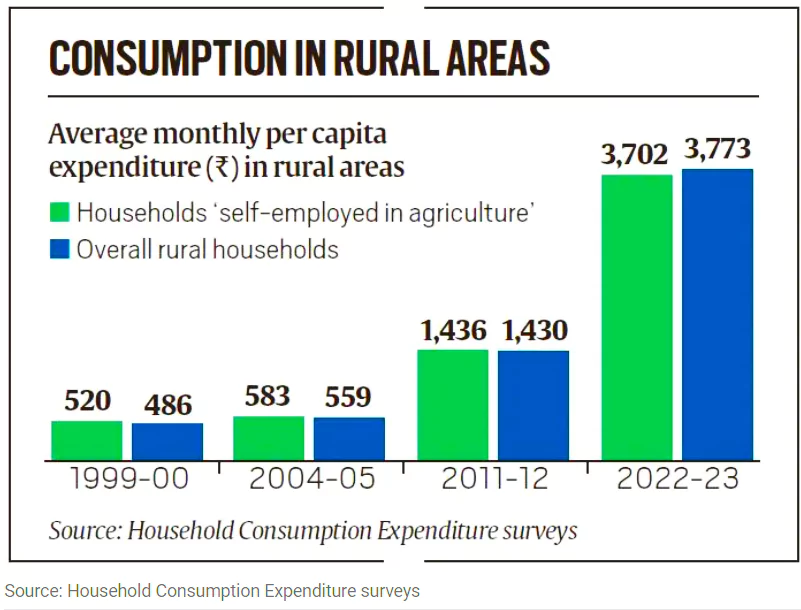
Thus, the most recent data is only comparable to the data from 2011–12. The government would only have been pleased to release the study in the lead-up to the Lok Sabha election because it presents a bright picture of consumption. The survey found that between 2011 and 2012, Indian households’ average monthly per capita consumption expenditure (MPCE) increased by 33.5% to Rs 3,510 in urban areas and by 40.42% to Rs 2,008 in rural areas.
Source: Only IAS
At 2011–12 prices, this translates to increases of 2.7% in urban areas and 3.1% in rural regions. Although this growth was reasonable, it was far less than the 5.7% yearly average GDP growth during this time and the rate of inflation. Thus, one conclusion that might be drawn is that governmental spending, rather than private consumption, was the primary driver of GDP expansion during this time.
There have been some intriguing shifts in the consumption pattern from the past. There has been a decline in food expenditure in both urban and rural areas. Cereals experienced a more severe decline. The cost of nourishing foods including eggs, meat, fish, milk, fruits, beverages, and processed foods is higher. Additionally, there is an increase in expenditure on consumer durables, services, health, and transportation.
Source: Study IQ IAS
It is thought that the relative decrease in food spending and the rise in discretionary spending are signs of a potential reduction in poverty. However, it has been highlighted that the free food grain delivery to more than 810 million people may have resulted in a decrease in food costs. A substantial degree of disparity is also evident in the data, with the bottom 5% of the population spending only 10% of what the top 5% spend.
The consumer price index (CPI) will be updated with the aid of the data, improving its representation of consumer purchasing trends. Cereals presently make up 4.89 percent of the total household consumption basket, while the CPI gives them a weight of 12.35 percent in rural regions. Only then would the CPI be most helpful in determining monetary policy and measuring inflation since it will accurately represent family spending patterns. However, because the study was conducted during the post-Covid months, when there was a spike in use, there are concerns about how representative the data is.
What do you think about this? Comment below.